The Correlation Between the Onset of Autoimmune Inflammatory Response and Gouty Arthritis


Abstract
Objective:
This study aimed to determine the concentration of anti-type II collagen (anti-CII) and interleukin-1 beta (IL-1β) in patients with hyperuricemia and to evaluate their relationship with uric acid and other hematological parameters.
Materials and Methods:
This case-control study included patients with chronic hyperuricemia and healthy controls. Serum uric acid levels, complete blood counts, and quantitative levels of IL-1β and anti-CII antibodies were measured using an enzyme-linked immunosorbent assay (ELISA).
Results:
A total of 80 patients with chronic hyperuricemia and 40 healthy controls were included in the study. Data analysis showed that uric acid (8.20 ± 1.06 mg/dL vs 4.99 ± 1.20 mg/dL; p<0.001), MID cells (627.48 ± 283.84 cells/µL vs 375.29 ± 173.43 cells/µL; p=0.001), anti-CII (9.67 ± 7.30 ng/mL vs 5.58 ± 1.35 ng/mL; p=0.027), and IL-1β (2.21 ± 2.18 pg/mL vs 0.94 ± 0.81 pg/mL; p=0.024) were significantly higher in patients than in controls. Regression analysis revealed a significant negative correlation between MID cells and hemoglobin (Hb) levels (R2=0.30; p=0.049). Notably, IL-1β was the only variable that showed a statistically significant effect on anti-CII levels (β=0.578, p=0.014).
Conclusion:
The study concludes that the anti-CII-mediated autoimmune response in gout occurs through an IL-1β-mediated production axis rather than as a direct consequence of elevated uric acid levels. Moreover, the negative correlation between MID cells and Hb suggests that chronic gout may exert a systemic suppressive effect on erythropoiesis.
Keywords:
Gouty, arthritis autoimmunity anti-CII IL-1β hyperuricemia MIDIntroduction
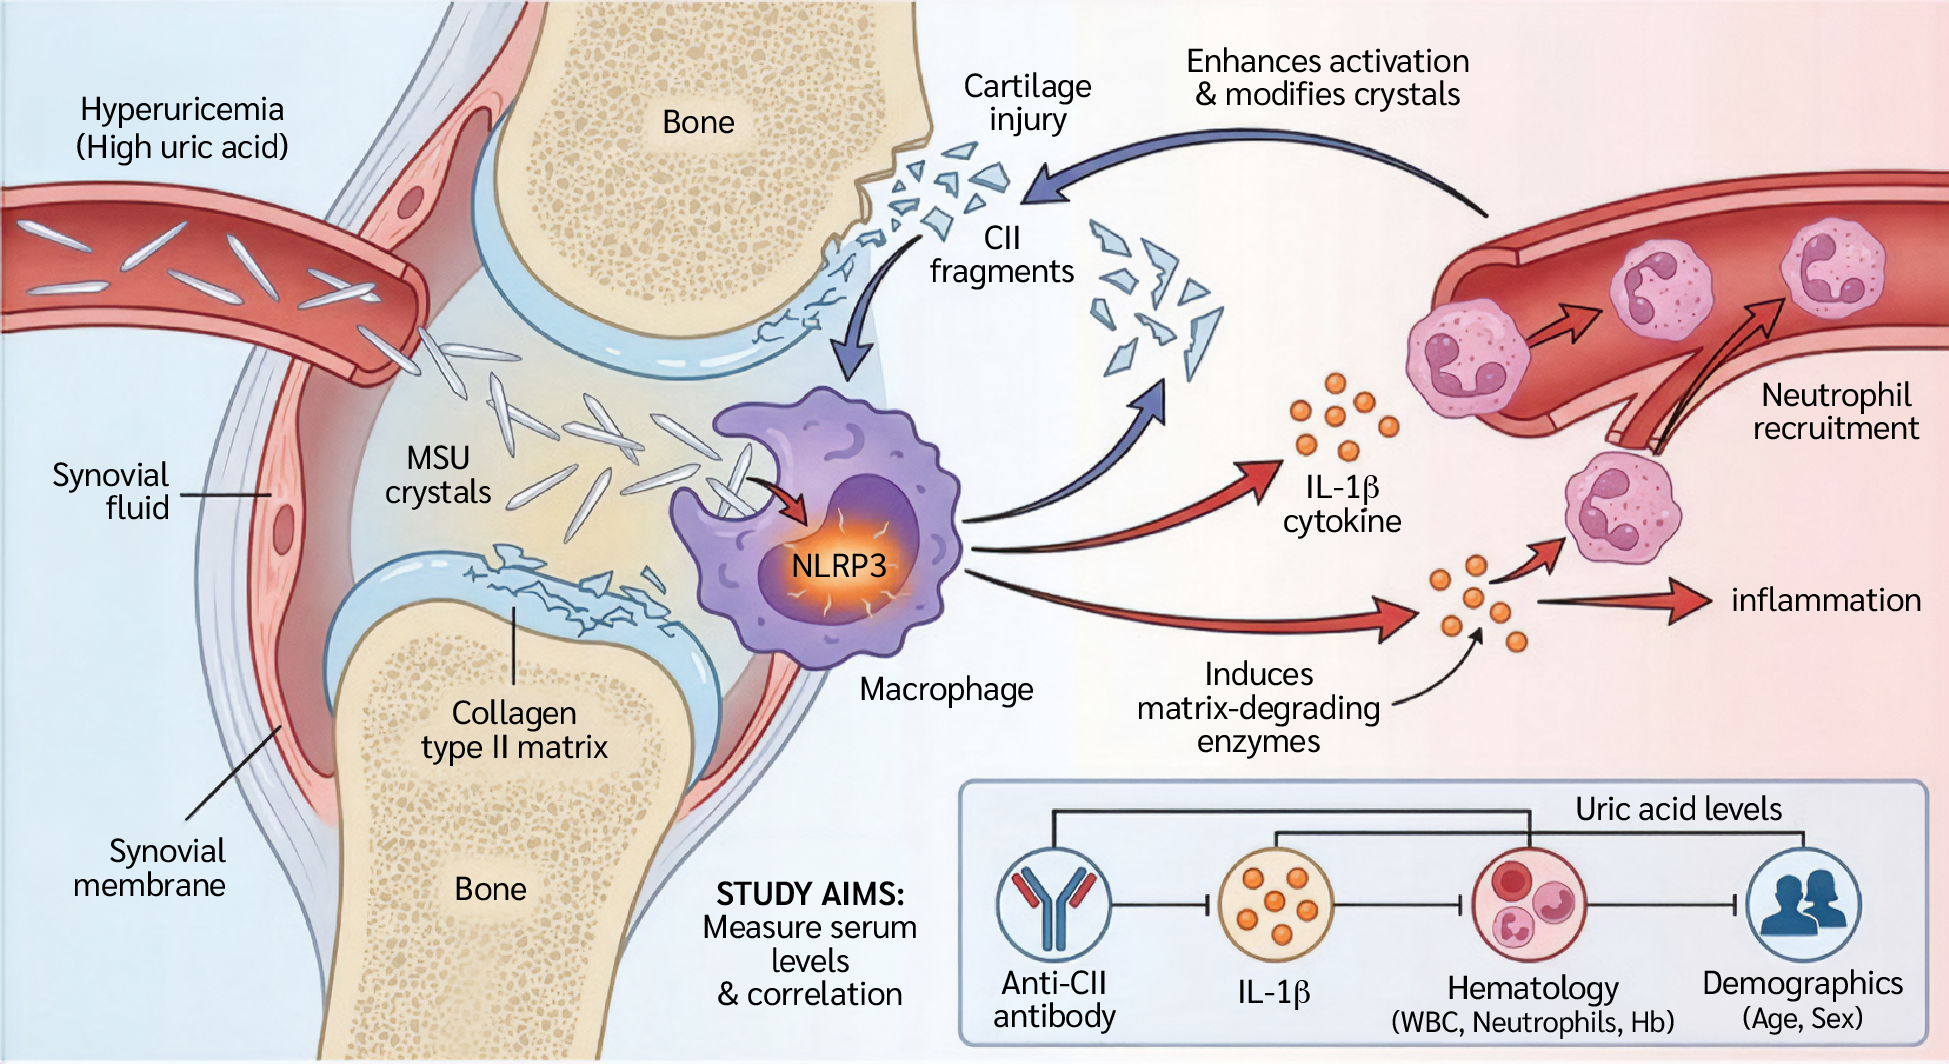
Gouty arthritis is a complex inflammatory condition associated with metabolic derangements and an enhanced innate immune response. Gout is caused by the accumulation of monosodium urate (MSU) crystals in the synovial fluid and joint tissues. However ,the transition from asymptomatic hyperuricemia to an acute, self-limiting attack is regulated by a complex network of immunological signals. At the heart of this network is the activation of the NLR family pyrin domain-containing 3 (NLRP3; formerly NOD-, LRR- and pyrin domain-containing protein 3) inflammasome and the ensuing release of interleukin-1 beta (IL-1β), a key proinflammatory cytokine that coordinates neutrophil recruitment and activation (1). However, MSU crystals and their associated cytokines do not solely determine the immune landscape of gout. The articular environment, particularly the extracellular matrix, which is mainly composed of type II collagen (CII), also modulates the inflammatory response (2). Recent research has shown that injury to articular cartilage and the release of CII fragments act as immunological modifiers that influence the structural properties of MSU crystals and enhance macrophage activation (3).
This phenomenon creates a harmful feedback loop in which IL-1β-driven inflammation stimulates the production of matrix-degrading enzymes, releasing collagen fragments and thereby perpetuating the inflammatory response (4). Understanding this relationship requires an in-depth assessment of the molecular interplay between MSU crystals, IL-1β signaling, and the cartilage matrix (5).
Gouty arthritis begins with hyperuricemia, which occurs when blood uric acid levels exceed the physiological saturation point of approximately 6.8 mg/dL. In humans, purine metabolism ultimately produces uric acid, which is largely eliminated via the kidneys and intestines (6). When the concentration of urate ions (C₅H₃N₄O₃⁻) in the synovial fluid becomes supersaturated, needle-like MSU crystals begin to form. Crystal formation is not determined by concentration alone; the local microenvironment, including pH, electrolyte levels, and matrix components such as proteoglycans and collagen, also plays a crucial role (7). Elevated uric acid levels are often considered a risk factor for metabolic and inflammatory conditions. However, their systemic effects on immune markers and the hematological profile remain unclear. It is therefore important to investigate the relationship between high uric acid concentrations, the autoimmune marker anti-type II collagen (Anti-CII), and the pro-inflammatory cytokine IL-1β.
Furthermore, it is unclear how these markers vary across demographic variables such as age and sex or whether there are significant changes in hematological parameters, including white blood cell (WBC) counts, neutrophil counts, and hemoglobin (Hb) levels. To better understand the autoinflammatory response induced by uric acid, this study aimed to investigate these relationships. Therefore, this study aimed to investigate the relationship between uric acid levels, anti-CII antibodies, and IL-1β concentrations in patients with hyperuricemia and to evaluate their association with hematological parameters (Figure 1).

Materials and Methods
Patient Recruitment and Sample Collection
Samples were collected from patients with persistently elevated blood uric acid levels. Participants were recruited from Al-Salam Teaching Hospital, Ibn Sina Hospital, and several outpatient clinics. Sample collection took place between January and September 2025. Ethical approval for the study was granted by the Scientific and Ethical Committee of the University of Mosul, Iraq, in collaboration with the Iraqi Ministry of Health.
Study Subjects
This study involved participants aged 25–65 years, including patients diagnosed with chronic hyperuricemia. The control group comprised healthy individuals with no history of elevated serum uric acid (SUA) levels. Patients were diagnosed with gouty arthritis by specialist rheumatologists according to the 2015 American College of Rheumatology (ACR)/European Alliance of Associations for Rheumatology (EULAR) classification criteria for gout. Diagnosis required a combination of clinical presentation (history of acute inflammatory arthritis episodes), laboratory findings (SUA levels > 6.8 mg/dL), and the presence of tophi. Individuals with asymptomatic hyperuricemia alone were excluded from the patient cohort to ensure that the evaluated inflammatory markers accurately represented the active disease state. Exclusion criteria for all participants included active bacterial or viral infections, autoimmune diseases, and the use of pharmacological therapies or antibiotics.
Serum Collection
Three milliliters of venous blood were collected from each participant and divided into two tubes: one containing ethylenediaminetetraacetic acid (EDTA) for complete blood count analysis and the other containing a serum separator gel. The gel tubes were centrifuged at 5000 rpm for 10 minutes to obtain serum. Aliquots of serum were then transferred to Eppendorf tubes and stored at -20°C until further analysis (8).
Estimation of Serum Uric Acid
Principle
This reaction produces allantoin and hydrogen peroxide (H₂O₂). The generated hydrogen peroxide then reacts with 4-aminoantipyrine and a phenolic compound (such as dichlorophenol sulfonate) in the presence of peroxidase (POD) to form a colored quinonimine complex. The intensity of the resulting red-pink color is directly
proportional to the uric acid concentration in the sample (9).
Complete Blood Count (CBC)
An automated Mythic™ 18 hematology analyzer (Orphée SA, Geneva, Switzerland) was used to measure 18 hematological parameters (10).
Human IL-1β (Interleukin-1 Beta) ELISA Kit
Principle
The Human IL-1β ELISA Kit (Catalog No. RE1074H; Reed Biotech Ltd, Shanghai, China) was used according to the manufacturer’s instructions. The assay utilizes a microplate pre-coated with a monoclonal antibody specific for human IL-1β. Samples and standards were added to the wells and incubated, allowing the target protein to bind to the immobilized antibody. Subsequently, a biotinylated detection antibody specific for IL-1β was added, followed by an additional incubation step.
After removal of unbound components, an avidin-horseradish peroxidase (HRP) conjugate was added to the wells and incubated again.
Following a final wash to eliminate excess conjugate, a substrate solution was added, producing a blue color whose intensity was proportional to the amount of bound IL-1β. The reaction was stopped using a stop solution, causing the color to change from blue to yellow. The optical density (OD) was measured spectrophotometrically at 450 nm, and IL-1β concentrations in the samples were calculated by interpolation from a standard curve generated using standards of known concentrations (11,12).
Procedure
Microplate strips were removed from the frame, and the remaining strips were returned to the aluminum foil bag containing desiccants and sealed for storage.
Standard, blank, and sample wells were designated. A volume of 100 μL of diluted standards, blank solution, and sample dilutions was added to the appropriate wells. The plate was sealed with the kit sealer and incubated at 37°C for 90 minutes. Solutions were added carefully to the bottom of the wells without touching the well walls to avoid foaming.
The plate was aspirated and cleaned three times. Immediately afterward, 100 μL of biotinylated detection antibody working solution was added to each well. A new sealer was applied, and the plate incubated at 37°C for 1 hour.
After decanting the solution, 300 μL of wash buffer was added to each well. After 0.5 minutes, the solution was aspirated or decanted, and the plate was patted dry on clean absorbent paper. The washing procedure was repeated three times. Test strips were used immediately after washing, and wells were not allowed to dry.
A volume of 100 μL of HRP conjugate working solution was added to each well. A new sealer was applied, and the plate was incubated at 37°C for 30 minutes.
After decanting the solution from each well, the washing procedure described in step 4 was repeated three times.
A volume of 100 μL of substrate reagent was added to each well. The plate was covered with a new sealer and incubated at 37°C for 15 minutes in the dark. Optical density was measured after a 15-minute microplate preheating and reading step.
A volume of 50 μL of stop solution was added to each well in the same sequence as the substrate solution.
The OD at 450 nm of each well was measured immediately using a microplate reader.
Human Anti-Type II Collagen Antibody (Anti-CIIAb) Enzyme-Linked Immunosorbent Assay (ELISA) Kit
Principle
The Human Anti-Type II Collagen Antibody (Anti-CIIAb) ELISA Kit (Catalogue No. EH5105; FineTest, Wuhan Fine Biotech Co., Ltd, Wuhan, China) was used according to the manufacturer’s instructions. The assay utilizes an indirect ELISA method in which specific antigens are pre-coated onto a 96-well microplate. Detection is achieved using a biotin-conjugated antibody system.
Standards and samples were added to the wells and incubated. After the initial incubation, unbound components were removed by washing, and a biotinylated detection antibody was added.
Following additional washing to remove unbound material, HRP-conjugated streptavidin was applied. The enzymatic activity of HRP was visualized by adding 3,3′,5,5′-tetramethylbenzidine (TMB) substrate, producing a blue color that turned yellow after the addition of an acidic stop solution.
The OD was measured at 450 nm using a microplate reader. The concentration of the target antibody in the samples was directly proportional to the OD450 values and was calculated using a standard curve (13).
Procedure
Preparation and loading of samples: The pre-coated microplate was prepared by designating appropriate wells for standards, samples, and blank controls. All measurements were performed in triplicate to minimize experimental error. A volume of 100 μL of each standard solution was added to the designated standard wells. A volume of 100 μL of sample dilution buffer was added to the blank control wells, whereas 100 μL of diluted serum samples was added to the sample wells. The plate was sealed and incubated at 37°C for 90 minutes. Solutions were carefully dispensed into the bottom of the wells without touching the well walls to avoid foaming.
Initial washing and antibody incubation: After incubation, the liquid was aspirated, and the plate was gently blotted on absorbent paper. The wells were washed twice with 350 μL of wash buffer without soaking. Subsequently, 100 μL of biotin-conjugated antibody working solution was added to each well. The plate was sealed and incubated statically at 37°C for 60 minutes. Following incubation, the plate was washed three times by immersing the wells in 350 μL of wash buffer for 1 min and discarding the liquid.
SABC conjugation and chromogenic development: A volume of 100 μL of the HRP-streptavidin-biotin complex (SABC) working solution was added to each well and incubated at 37°C for 30 minutes. The TMB substrate solution was equilibrated to 37°C before use.
The plate then underwent five washing cycles using the previously described immersion washing procedure. Subsequently, 90 μL of TMB substrate was added to each well. The plate was sealed and incubated in the dark at 37°C for 10–20 minutes. Color development was monitored visually, and the incubation time did not exceed 30 minutes. A clear color gradient was observed in the standard wells.
Stopping the reaction and measuring: The enzymatic reaction was terminated by adding the stop solution in the same sequence as the TMB substrate was added. After the stop solution was added, the color in each well immediately changed to yellow. Optical density was measured immediately at 450 nm using a microplate reader. To correct background interference, wavelength correction was performed using reference readings at either 570 nm or 630 nm before calculating the final OD450 values.
Statistical Analysis
Data were analyzed using IBM SPSS Statistics for Windows, version 26.0 (IBM Corp., Armonk, NY, USA). Descriptive statistics were expressed as mean ± standard deviation (SD). Differences between hyperuricemic patients and healthy controls were evaluated using the independent-samples t-test. Associations between hematological parameters and inflammatory markers were examined using simple linear regression analysis. Additionally, a multiple linear regression analysis was performed to identify independent predictors of anti-CII levels. Statistical significance was set as p<0.05.
Results
This study involved a total 120 participants, including 80 patients with chronic hyperuricemia and 40 healthy controls with no history of elevated SUA levels.
Statistical Implications of the Current Study Groups
The differences between the study variables are presented in Table 1. Statistical analysis demonstrated that serum uric acid levels were significantly higher in the patient group (8.20 ± 1.06 mg/dL) compared with the control group (4.99 ± 1.20 mg/dL; t=9.992, p<0.001). Similarly, MID cell counts were significantly elevated in patients (p=0.001).
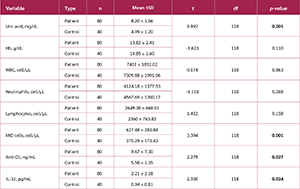
Regarding immunological markers, both anti-CII and IL-1β levels were significantly higher in the patient group compared with controls (p=0.027 and p=0.024, respectively). In contrast, no statistically significant differences were observed between the two groups in Hb levels (p=0.110), WBC (p=0.863), neutrophil count (p=0.268), or lymphocyte count (p=0.158).
Simple Linear Regression Analyses
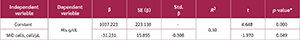
Association Between MID Cell Count and Hemoglobin
A simple linear regression analysis was performed to evaluate the relationship between MID cell count and Hb levels (Table 2). The analysis demonstrated a statistically significant negative association between MID cell count and Hb levels (β=-31.231, t=-1.970, p=0.049). The coefficient of determination indicated that MID cell count explained 30% of the variance in Hb levels (R2=0.30). These findings suggest that higher MID cell counts are associated with lower Hb levels.
Association Between Neutrophil Count and Hemoglobin
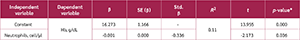
A simple linear regression analysis was conducted to examine the relationship between neutrophil count (cells/µL) and Hb levels (g/dL) (Table 3). The results revealed a statistically significant negative association between neutrophil count and Hb levels (β=-0.001, t=-2.173, p=0.036). The coefficient of determination (R2) was 0.11.
Multiple Linear Regression Analysis
A multiple linear regression model was constructed to evaluate the effects of uric acid (mg/dL), MID cell count (cells/µL), Hb levels (g/dL), and IL-1β (pg/mL) on anti-CII levels (ng/mL) (Table 4).
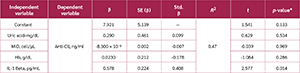
The analysis showed that:
Uric acid was not significantly associated with anti-CII levels (p=0.534).
MID cell count was not significantly associated with anti-CII levels (p=0.969).
Hemoglobin levels were not significantly associated with anti-CII levels (p=0.286).
IL-1β showed a significant positive association with anti-CII levels (p=0.014).
The regression coefficient (β=0.578) indicated that each 1-unit increase in IL-1β was associated with an increase of 0.578 ng/mL in anti-CII levels.
The coefficient of determination showed that 47% of the variance in IL-1β levels was explained by the variables included in the model, while the remaining 53% may be attributable to other factors not included in the analysis.
Discussion
The present study demonstrates clear biochemical and immunological differences between patients with gouty arthritis and healthy controls. The most prominent finding was the significantly elevated SUA levels in the patient group compared with controls. These values exceed the physiological saturation threshold for MSU, thereby promoting crystallization within joint tissues. This observation aligns with the treat-to-target approach in gout management, which recommends maintaining SUA levels below 6.0 mg/dL to prevent crystal formation and recurrent flares (14).
In addition to hyperuricemia, patients exhibited a significant increase in MID cell counts, likely reflecting enhanced monocyte activity. Recent immunological studies have shown that hyperuricemia induces a form of trained immunity in monocytes. Once recruited to the synovium, these cells phagocytose MSU crystals and activate the NLRP3 inflammasome (15). This intracellular mechanism likely explains the concurrent significant rise in IL-1β observed in our patient cohort. IL-1β is the key cytokine in gouty inflammation, responsible for neutrophil recruitment and the intense pain characteristic of acute flares.
Another important finding of this study is the significant elevation of anti-CII antibodies in patients with gout. Although anti-CII antibodies are traditionally associated with rheumatoid arthritis, emerging evidence indicates that chronic crystal-induced inflammation can lead to citrullination of proteins in the joint environment, triggering an autoantibody response. These findings support the growing theory that chronic gout may involve an autoimmune reactivity driven by persistent tissue damage (16,17).
Regression analysis revealed a significant negative relationship between MID cell counts and Hb levels. This association may reflect the systemic inflammatory burden in gouty arthritis. Activated monocytes and macrophages produce cytokines such as IL-1β and tumor necrosis factor alpha (TNF-α) (18). Recent studies indicate that chronic inflammatory signaling induces hepcidin, a liver-derived hormone that sequesters iron, thereby disrupting iron metabolism and reducing its availability for erythropoiesis (19). This mechanism underlies the anemia of chronic disease (ACD), also called anemia of inflammation, explaining the lower Hb levels in patients with elevated inflammatory markers (higher MID) (20). The significance level in our regression analysis suggests that immune activation in gout extends beyond the joints, potentially exerting a suppressive effect on erythropoiesis and contributing to subclinical anemia in chronic gout patients.
Additionally, neutrophil counts demonstrated a statistically significant negative correlation with Hb levels. However, the low regression coefficient indicated that neutrophils have a measurable negative impact on Hb levels in this population. Neutrophils are major effector cells in gouty inflammation, releasing a cascade of pro-inflammatory cytokines upon activation, most notably IL-1β and IL-6. Elevated neutrophil activity in gouty arthritis patients may therefore reflect a broader systemic inflammatory state rather than a purely localized joint response (21). Our findings indicate that as this inflammatory burden increases (as reflected in elevated neutrophil counts), a corresponding decline in Hb levels may occur.
The inverse correlation can be explained by ACD mechanism. Recent studies (22) show that chronic inflammation induces hepatic production of hepcidin, the key regulator of iron homeostasis. Elevated IL-6, driven by neutrophil activity, stimulates hepcidin, which inhibits ferroportin, leading to iron sequestration within macrophages and reduced intestinal absorption (23). In addition, TNF-α and other neutrophil-derived factors can directly suppress erythroid progenitor cells in the bone marrow and diminish the biological activity of erythropoietin (EPO).
It has been shown that approximately 11% of the variation in Hb levels is explained by neutrophil count. While this confirms that neutrophils are an independent predictor, the remaining 89% of the variance is likely attributable to multifactorial causes common in gout patients, including renal impairment and chronic kidney disease, which affect EPO production; pharmacological factors, such as long-term use of nonsteroidal anti-inflammatory drugs (NSAIDs) leading to subclinical gastrointestinal blood loss; and nutritional status, including diet-related iron or vitamin deficiencies.
Nevertheless, the statistically significant difference demonstrates that the neutrophil-Hb axis may represent an important component of the systemic inflammatory burden in gout. Recent studies have suggested that the neutrophil-to-Hb ratio may serve as a potential biomarker for monitoring disease activity in inflammatory arthropathies (24).
The multiple linear regression analysis revealed that IL-1β was the only significant predictor of anti-CII levels. The positive and significant correlation between IL-1β and anti-CII can be explained through the inflammasome-cartilage damage axis. In gouty arthritis, the deposition of MSU crystals activates the NLRP3 inflammasome in macrophages, provoking a robust release of IL-1β (25). This proinflammatory cytokine stimulates the production of matrix metalloproteinases, which directly degrade type II collagen in the articular cartilage. As collagen fragments are released into the joint space, immune tolerance may be disrupted, leading to the production of anti-CII autoantibodies (26).
Interestingly, the initial hypothesis proposed a direct relationship between SUA and anti-CII; however, statistical analysis did not support this. This divergence may be explained by the “crystallization paradox.” Serum hyperuricemia represents a systemic metabolic state, whereas pathologic cartilage destruction is a local inflammatory event (27). Clinical evidence suggests that elevated SUA does not necessarily indicate active crystal deposition or acute inflammation, as seen in asymptomatic hyperuricemia (28). Therefore, the local inflammatory process mediated by IL-1β appears to be more strongly associated with the autoimmune response rather than circulating uric acid levels (29,30).
Taken together, these findings suggest that gouty arthritis involves complex interactions between metabolic disturbances, innate immune activation, and potential autoimmune responses. Beyond the classical role of uric acid, inflammatory mediators such as IL-1β may represent key drivers linking crystal deposition, cartilage damage, and systemic inflammatory effects.
Conclusion
This study highlights the complex interplay between hyperuricemia, systemic inflammation, and potential autoimmune responses in patients with gouty arthritis. While elevated uric acid levels remain central to disease pathogenesis, our findings suggest that IL-1β-mediated inflammation may play a pivotal role in linking crystal deposition with cartilage damage and anti-CII antibody production. Additionally, the observed associations between inflammatory cell counts and hemoglobin levels indicate that the systemic inflammatory burden of gout may influence erythropoiesis. These results underscore the importance of therapeutic strategies targeting not only urate reduction, but also inflammatory pathways involved in disease progression.
Ethical Approval
Ethical approval for the study was granted by the Scientific and Ethics Committee of the University of Mosul, Iraq, in collaboration with the Iraqi Ministry of Health on March 28, 2024 with decision no. 4s/34.
Informed Consent
Written informed consent was obtained from each participant, confirming their understanding of the voluntary nature of participation and their right to withdraw at any time without penalty.
Peer-review
Externally peer-reviewed
Author Contributions
Concept – R.G.M.A., E.W.A., H.A.A.; Design – R.G.M.A., H.A.A.; Supervision – R.G.M.A.; Fundings – R.G.M.A., E.W.A.; Materials – R.G.M.A., E.W.A.; Data Collection and/or Processing – R.G.M.A., E.W.A.; Analysis and/or Interpretation – R.G.M.A., E.W.A., H.A.A.; Literature Review – R.G.M.A.; Writer – R.G.M.A.; Critical Reviews – R.G.M.A.
Conflict of Interest
The author declares no conflict of interest.
Financial Disclosure
The authors declared that this study has no financial support.
Acknowledgment
The authors would like to thank the Department of Biology, College of Science, University of Mosul, for their contribution and support in completing this manuscript.
AI Statement
The authors used Grammarly to improve the language and readability of the manuscript. After using this tool, the authors reviewed and edited the content as needed and took full responsibility for the final version of the manuscript.
References
Zhao J, Wei K, Jiang P, Chang C, Xu L, Xu L, et al. Inflammatory response to regulated cell death in gout and its functional implications. Front Immunol. 2022;13:888306. [CrossRef]
Sandoval-Plata G, Morgan KM, Doherty M, Abhishek A. Inter-critical gout, not hyperuricemia or asymptomatic urate crystal deposition, is associated with systemic inflammation. Gout Urate Crystal Depos Dis. 2025;3(3):11. [CrossRef]
Xie X, Song Y, Chen W, Zhao H, Chu N, Wang F. Association between circulating inflammatory proteins and gout: A Mendelian randomization study. Medicine (Baltimore). 2025;104(20):e42379. [CrossRef]
Grant MP, Alad M, Yousef F, Epure LM, Antoniou J, Mwale F. Link N directly targets IL-1β to suppress inflammation and regulate sensory pain in intervertebral disc degeneration. Biomolecules. 2025;15(4):603. [CrossRef]
Wahi K, Kodar K, McConnell MJ, Harper JL, Timmer MSM, Stocker BL. MSU Crystals Enhance TDB-Mediated Inflammatory Macrophage IL-1β Secretion. Inflammation. 2019;42(3):1129–36. [CrossRef]
Roman YM. The role of uric acid in human health: insights from the uricase gene. J Pers Med. 2023;13(9):1409. [CrossRef]
Sansano-Muñoz E, López-González MC, Rodríguez-Alvear C, Calabuig I, Martínez-Sanchis A, Rodríguez-Navarro C, et al. Length of monosodium urate crystals in synovial fluid based on ultrasound articular deposits: advancements in crystallization process. Gout Urate Crystal Depos Dis. 2025;3(4):21. [CrossRef]
Kang T, Yun SG, Nam MH, Cho Y, Nam M. Comparative evaluation of serum separator V-Tube™, VQ-Tube™, and K2EDTA V-Tube™ with Becton Dickinson Tubes for chemistry, immunology, and hematology examinations. Diagnostics (Basel). 2025;15(14):1775. [CrossRef]
Rajamanikandan R, Ilanchelian M, Ju H. Highly selective uricase-based quantification of uric acid using hydrogen peroxide sensitive poly-(vinylpyrrolidone) templated copper nanoclusters as a fluorescence probe. Chemosensors. 2023;11(5):268. [CrossRef]
Al-Allaff RGM, Bakr Al-Sawaf TM. Correlation between a deficiency of D3 levels and the development of allergic rhinitis. Pak J Biol Sci. 2024;27(1):27–34. [CrossRef]
Tsai TC, Wang YW, Lee MS, Wu WN, Hsu W, Yao DJ, et al. Detection of interleukin-1 β (IL-1β) in single human blastocyst-conditioned medium using ultrasensitive bead-based digital microfluidic chip and its relationship with embryonic implantation potential. Int J Mol Sci. 2024;25(7):4006. [CrossRef]
Hiba A.M.AL-Heyali H, G.M.AL-Allaff R. Novelty in colorectal cancer biomarkers: the predictive value and clinical utility of the carcinoembryonic antigen and aldehyde dehydrogenase 1B1 autoantibodies for assessing tumour biology and the cancer stem cell burden. Asian Pac J Cancer Biol. 2025;10(4):905–13. [CrossRef]
Lewandowska K, Mikuła-Pietrasik J, Książek K, Tykarski A, Uruski P. Uric acid promotes human umbilical vein endothelial cell senescence in vitro. Metabolites. 2025;15(6):402. [CrossRef]
Moses A, Voshaar MO, Laar Mvd, Jansen TLT. Treat to target in gout management: a critical reappraisal of current strategies. Gout Urate Cryst Depos Dis. 2025;3(1):3. [CrossRef]
Yu Q, Sun Z, Wang Y, Du X, Huang J, Wang L. Hyperuricemia is accompanied by elevated peripheral CD4+ T cells. Sci Rep. 2023;13(1):12537. [CrossRef]
Tilvawala R, Nguyen SH, Maurais AJ, Nemmara VV, Nagar M, Salinger AJ, et al. The rheumatoid arthritis-associated citrullinome. Cell Chem Biol. 2018;25(6):691–704.e6. [CrossRef]
Liu YR, Wang JQ, Li J. Role of NLRP3 in the pathogenesis and treatment of gout arthritis. Front Immunol. 2023;14:1137822. [CrossRef]
Gao L, Liu C, Ye G, Gao Y, Wang H. Advancing gouty arthritis research: the clinical value of complete blood cell count ratios and immune-inflammatory interactions. J Inflamm Res. 2025;18:16597–610. [CrossRef]
Quintana-Castanedo L, Maseda R, Pérez-Conde I, Butta N, Monzón-Manzano E, Acuña-Butta P, et al. Interplay between iron metabolism, inflammation, and EPO-ERFE-hepcidin axis in RDEB-associated chronic anemia. Blood Adv. 2025;9(9):2321–35. [CrossRef]
Cabău G, Crișan TO, Klück V, Popp RA, Joosten LAB. Urate-induced immune programming: Consequences for gouty arthritis and hyperuricemia. Immunol Rev. 2020;294(1):92–105. [CrossRef]
Li C, Wu C, Li F, Xu W, Zhang X, Huang Y, et al. Targeting neutrophil extracellular traps in gouty arthritis: insights into pathogenesis and therapeutic potential. J Inflamm Res. 2024;17:1735–63. [CrossRef]
Weiss G, Ganz T, Goodnough LT. Anemia of inflammation. Blood. 2019;133(1):40–50. [CrossRef]
Joosten LAB, Crişan TO, Bjornstad P, Johnson RJ. Asymptomatic hyperuricaemia: a silent activator of the innate immune system. Nat Rev Rheumatol. 2020;16(2):75–86. [CrossRef]
Zhang H, Liu J, Lin R, Xie D, Lin W, Zhang Q, et al. Neutrophil-to-lymphocyte ratio predicts inpatient gout recurrence: a large-scale multicenter retrospective cohort with machine-learning validation. Front Immunol. 2025;16:1688516. [CrossRef]
Wu M, Hu X, Lu T, Liu C, Lu H. Uric acid is independently associated with interleukin-1β levels in tear fluid of hyperuricemia and gout patients. Immun Inflamm Dis. 2023;11(3):e805. [CrossRef]
Li D, Yuan S, Deng Y, Wang X, Wu S, Chen X, et al. The dysregulation of immune cells induced by uric acid: mechanisms of inflammation associated with hyperuricemia and its complications. Front Immunol. 2023;14:1282890. [CrossRef]
Mdivnishvili M, Kharebashvili M, Chumburidze V, Nadaraia K, Gujejiani L, Virkovi K. The impact of hyperuricemia on the progression of atherosclerotic cardiovascular disease. Cureus. 2025;17(10):e94371. [CrossRef]
Deng H, Zhang X, Cheng N, Zhang J, Song C, Sun Y, et al. Asymptomatic hyperuricemia associated with increased risk of nephrolithiasis: a cross-sectional study. BMC Public Health. 2023;23(1):1525. [CrossRef]
Dinarello CA. How interleukin-1β induces gouty arthritis. Arthritis Rheum. 2010;62(11):3140–4. [CrossRef]
Ahn EY, So MW. The pathogenesis of gout. J Rheum Dis. 2025;32(1):8–16. [CrossRef]
VOLUME
,
ISSUE
Correspondence
Received
Accepted
Published
Suggested Citation
DOI
License
